> ## Documentation Index
> Fetch the complete documentation index at: https://docs.sigmamind.ai/llms.txt
> Use this file to discover all available pages before exploring further.
# Chat Analytics
> Monitor chat and ticket performance, tool usage, and intent detection across your SigmaMind AI agents.
The **Chat Analytics** dashboard tracks how your AI agents handle text-based interactions — across chat, email, and phone (ticket) channels. Use it to measure volume, cost efficiency, tool usage, and the intents your agents are resolving.
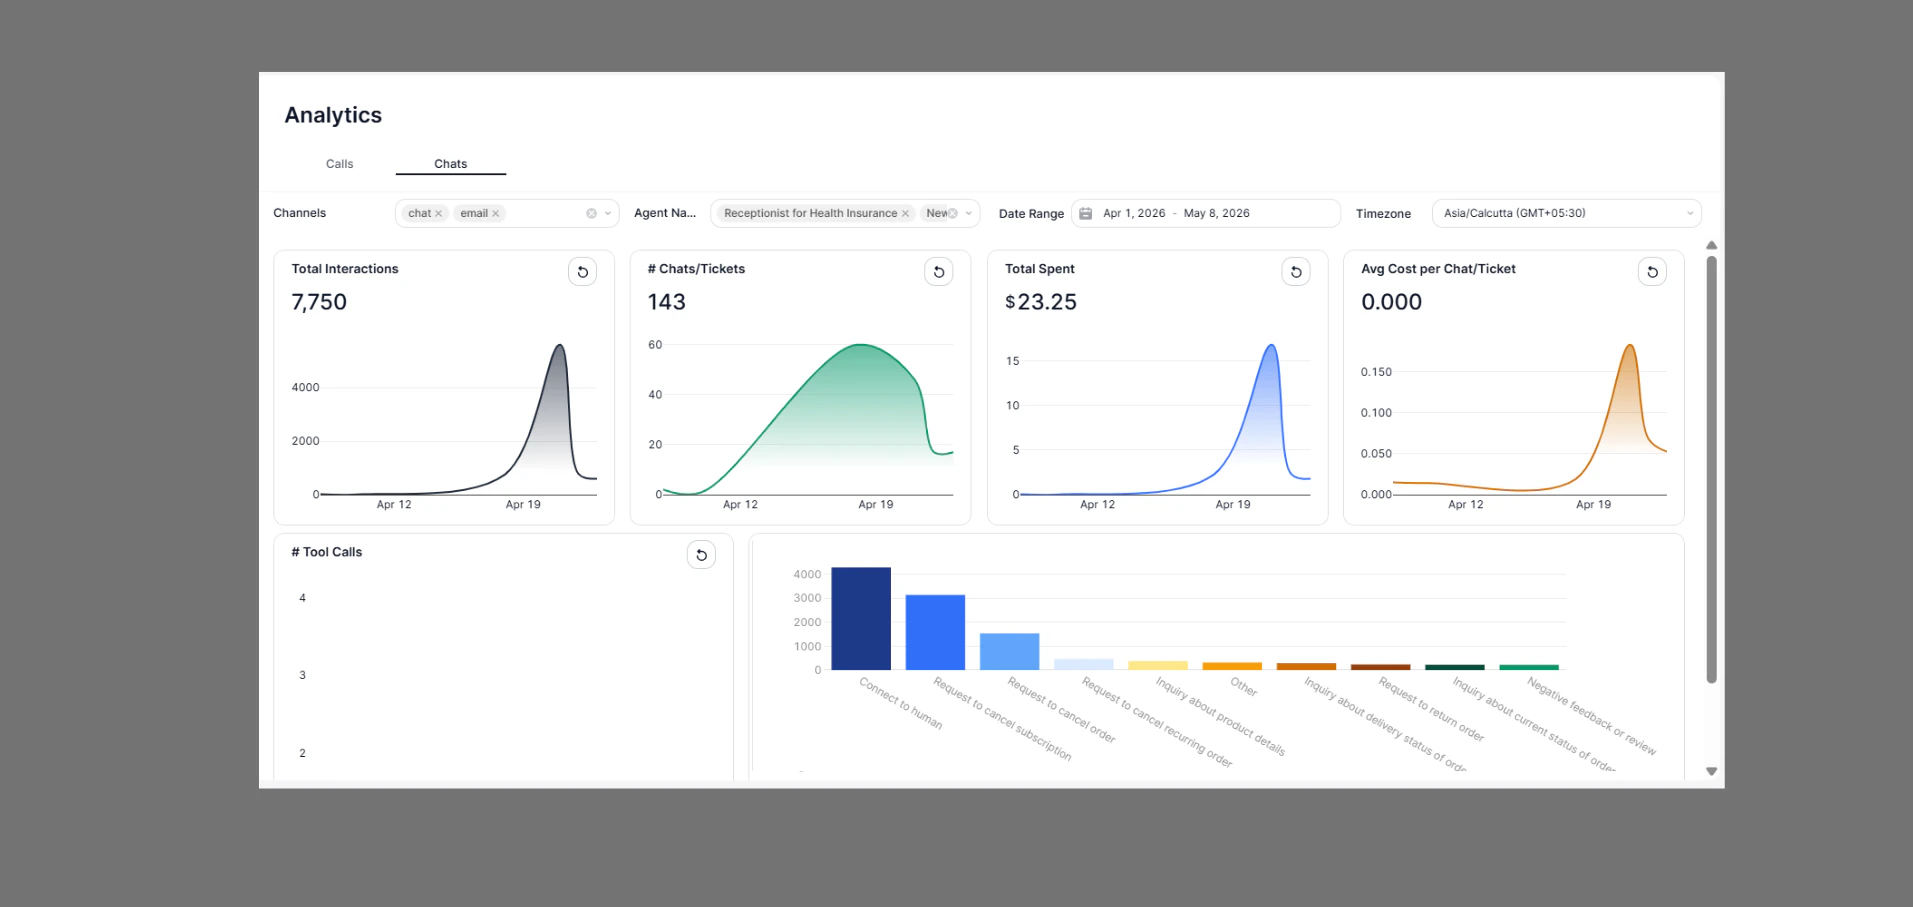 Chat Analytics are scoped by **Channel**, **Agent Name**, **Date Range**, and **Timezone**. Use the filter bar at the top to narrow your view. Supported channels: `chat`, `email`, `phone`.
***
## Key Metrics
The total number of messages or exchanges handled across all selected channels and agents. Includes every turn in a conversation, not just conversation starts.
The number of distinct chat sessions or support tickets opened during the period. Use this to understand conversation volume independent of message depth.
Cumulative cost across all chat interactions. Chat-based agents are generally lower cost than voice agents since telephony charges do not apply.
Total spend divided by number of chats or tickets. A rising average may indicate longer conversations or heavier tool use per session.
***
## Volume Trends
The **Total Interactions** and **# Chats/Tickets** charts display activity over time, grouped by your chosen interval (Hours, Days, Weeks).
| Pattern | What it means |
| -------------------------------------- | --------------------------------------------------------------------------------- |
| Interactions growing faster than chats | Conversations are getting longer — agents may need more turns to resolve requests |
| Chats spike, interactions flat | Short, transactional sessions dominating — typical for FAQ-style agents |
| Gradual ramp then sharp spike | Testing phase transitioning to real or bulk traffic |
| Flat interactions across period | Consistent, stable usage — a sign of a mature deployment |
Compare **Total Interactions** against **# Chats/Tickets** to derive the implicit **avg messages per conversation** — a useful proxy for resolution complexity.
***
## Tool Calls
The **# Tool Calls** chart shows how many times agents invoked external tools (e.g. knowledge base look-ups, CRM queries, appointment APIs, form submissions) across chat sessions.
If your agents are configured with tools but the tool-call count is consistently 0, check that your agent's intent-to-tool mappings are correctly defined. Low tool usage on agents designed to use tools is a common misconfiguration signal.
Tool call data is broken down by day so you can correlate spikes in tool usage with specific conversation volumes or agent deployments.
***
## Intents
The **Intents** chart visualises the topics and goals your agents detected during conversations. Each bar or data point represents a recognised intent category and how frequently it appeared across sessions.
Intent detection requires that your agent has intent classification enabled. If the Intents chart appears empty, verify that your agent configuration includes an intent schema or classifier. See [Agent Configuration](/agents/configuration) for setup instructions.
Common use cases for intent data:
* Identify which topics drive the most volume so you can prioritise knowledge base improvements
* Spot intents with high frequency but low resolution rate — signals where agents need better training
* Detect unexpected intents that suggest callers or users have needs your agent is not designed to handle
***
## Channels
Chat Analytics aggregates data across three channel types:
| Channel | Description |
| --------- | -------------------------------------------------------------------- |
| **chat** | Live or async chat sessions from your web widget, mobile SDK, or API |
| **email** | Email threads processed by your AI agent as a support ticket |
To add or remove channels from the analytics view, use the **Channels** multi-select filter at the top of the page. Each channel can also be analysed independently by deselecting the others.
***
## Cost Behaviour
Unlike voice calls, chat interactions are not subject to telephony or TTS/STT charges. Chat cost is driven almost entirely by **LLM inference** — the number of tokens processed per conversation turn.
Factors that influence chat cost:
* **System prompt length** — loaded on every conversation start
* **Conversation history** — longer threads pass more context tokens per turn
* **Tool call responses** — tool results injected into context add tokens
* **Model tier** — higher-capability models cost more per token
If **Avg Cost per Chat/Ticket** is rising without a corresponding increase in resolution quality, audit your system prompt for verbosity and consider whether a lighter model tier meets your accuracy needs for common intents.
***
## Filters & Controls
| Control | Options | Notes |
| -------------- | ----------------------------- | ------------------------------------------- |
| **Channels** | `chat` · `email` · `phone` | Multi-select; all channels shown by default |
| **Agent Name** | Multi-select from your agents | Filter to one or more specific agents |
| **Date Range** | Custom start / end date | Maximum range: 90 days |
| **Timezone** | Any IANA timezone | Defaults to your account timezone |
Use the **↺ refresh icon** on any individual chart to reload that metric without refreshing the full dashboard.
Chat Analytics are scoped by **Channel**, **Agent Name**, **Date Range**, and **Timezone**. Use the filter bar at the top to narrow your view. Supported channels: `chat`, `email`, `phone`.
***
## Key Metrics
The total number of messages or exchanges handled across all selected channels and agents. Includes every turn in a conversation, not just conversation starts.
The number of distinct chat sessions or support tickets opened during the period. Use this to understand conversation volume independent of message depth.
Cumulative cost across all chat interactions. Chat-based agents are generally lower cost than voice agents since telephony charges do not apply.
Total spend divided by number of chats or tickets. A rising average may indicate longer conversations or heavier tool use per session.
***
## Volume Trends
The **Total Interactions** and **# Chats/Tickets** charts display activity over time, grouped by your chosen interval (Hours, Days, Weeks).
| Pattern | What it means |
| -------------------------------------- | --------------------------------------------------------------------------------- |
| Interactions growing faster than chats | Conversations are getting longer — agents may need more turns to resolve requests |
| Chats spike, interactions flat | Short, transactional sessions dominating — typical for FAQ-style agents |
| Gradual ramp then sharp spike | Testing phase transitioning to real or bulk traffic |
| Flat interactions across period | Consistent, stable usage — a sign of a mature deployment |
Compare **Total Interactions** against **# Chats/Tickets** to derive the implicit **avg messages per conversation** — a useful proxy for resolution complexity.
***
## Tool Calls
The **# Tool Calls** chart shows how many times agents invoked external tools (e.g. knowledge base look-ups, CRM queries, appointment APIs, form submissions) across chat sessions.
If your agents are configured with tools but the tool-call count is consistently 0, check that your agent's intent-to-tool mappings are correctly defined. Low tool usage on agents designed to use tools is a common misconfiguration signal.
Tool call data is broken down by day so you can correlate spikes in tool usage with specific conversation volumes or agent deployments.
***
## Intents
The **Intents** chart visualises the topics and goals your agents detected during conversations. Each bar or data point represents a recognised intent category and how frequently it appeared across sessions.
Intent detection requires that your agent has intent classification enabled. If the Intents chart appears empty, verify that your agent configuration includes an intent schema or classifier. See [Agent Configuration](/agents/configuration) for setup instructions.
Common use cases for intent data:
* Identify which topics drive the most volume so you can prioritise knowledge base improvements
* Spot intents with high frequency but low resolution rate — signals where agents need better training
* Detect unexpected intents that suggest callers or users have needs your agent is not designed to handle
***
## Channels
Chat Analytics aggregates data across three channel types:
| Channel | Description |
| --------- | -------------------------------------------------------------------- |
| **chat** | Live or async chat sessions from your web widget, mobile SDK, or API |
| **email** | Email threads processed by your AI agent as a support ticket |
To add or remove channels from the analytics view, use the **Channels** multi-select filter at the top of the page. Each channel can also be analysed independently by deselecting the others.
***
## Cost Behaviour
Unlike voice calls, chat interactions are not subject to telephony or TTS/STT charges. Chat cost is driven almost entirely by **LLM inference** — the number of tokens processed per conversation turn.
Factors that influence chat cost:
* **System prompt length** — loaded on every conversation start
* **Conversation history** — longer threads pass more context tokens per turn
* **Tool call responses** — tool results injected into context add tokens
* **Model tier** — higher-capability models cost more per token
If **Avg Cost per Chat/Ticket** is rising without a corresponding increase in resolution quality, audit your system prompt for verbosity and consider whether a lighter model tier meets your accuracy needs for common intents.
***
## Filters & Controls
| Control | Options | Notes |
| -------------- | ----------------------------- | ------------------------------------------- |
| **Channels** | `chat` · `email` · `phone` | Multi-select; all channels shown by default |
| **Agent Name** | Multi-select from your agents | Filter to one or more specific agents |
| **Date Range** | Custom start / end date | Maximum range: 90 days |
| **Timezone** | Any IANA timezone | Defaults to your account timezone |
Use the **↺ refresh icon** on any individual chart to reload that metric without refreshing the full dashboard.